Mobile app analytics show how people actually use your app: which screens they visit, where they get stuck, which features they ignore and where they give up. With that information, you can fix the real problems instead of guessing, and make each update count.
What to measure
- Active users: how many people use the app daily, weekly and monthly.
- Key journeys: how many complete sign-up, booking, purchase or a form.
- Drop-off points: the step where people give up.
- Feature use: which features are popular and which are ignored.
- Crashes and errors: what went wrong and on which devices.
- Retention: how many users come back after the first week.
Finding where users get stuck
Pick one important journey, such as booking or submitting a form, and measure each step. If 100 people start and only 40 finish, look at the step with the biggest drop. Often it is a confusing field, a slow screen or an unexpected request for information.
Analytics for staff apps
For internal apps, analytics show which forms take longest, where staff abandon tasks and whether the app is being used at all on certain sites. For apps like Force One and SitePro, that shows where to simplify forms or add training.
Analytics for customer apps
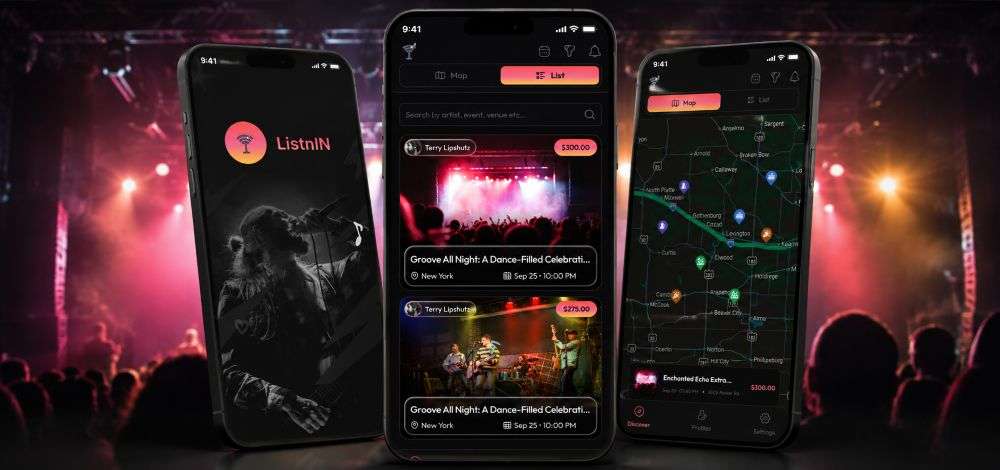
For customer apps and platforms such as Spa Specials, ListnIN or MySpec, analytics show which content attracts people, where purchases are abandoned and what brings users back.
Privacy
- Collect only what you need.
- Explain it in your privacy policy.
- Ask for consent where required.
- Avoid recording personal details in analytics.
Turning data into improvements
- Choose one problem the data reveals.
- Make a focused change.
- Release it and measure again.
- Keep what works, and move to the next problem.
Pair analytics with real feedback. Watching a few users complete a task often explains what the numbers show. See mobile app accessibility.
An example from our work
For staff apps such as SitePro and Force One, the useful measures are practical: are checks completed on time, which forms are left half-finished, and where does the office still chase people? Those figures show which screen to simplify next, which matters more than download numbers.
Checklist: setting up useful app analytics
- Agree the three or four actions that matter most in your app.
- Track where people start those actions and where they stop.
- Record app version and device type so problems can be traced.
- Ask for consent where it is needed and explain what you collect.
- Review the figures on a regular date, not just when something breaks.
- Turn each finding into one small change, then measure again.
How we work
We start by talking through how your business works today, then agree the scope, cost and timing in a written proposal. Before development, we design the screens so you can see how the system will work and suggest changes. We build in phases, handing over working sections for you to test, and at completion you receive the software, source code and database, with a month of support.
Common questions
Can analytics be added to an existing app?
Yes, usually with a small update.
Which analytics tools do you use?
It depends on the app and privacy needs. We choose tools that give useful insight without collecting unnecessary data.
How soon will we see useful data?
Often within a few weeks, depending on how many people use the app.
Do we need a separate dashboard for analytics?
Not always. Key figures can be shown in your app’s admin panel, so the people running the service see them alongside their other records.
Next step
If you want to know how your app is really used, book a free 15-minute software review.